
Live Imaging Finds Uneven NK-Cell Responses Within Ovarian Organoid Cultures
Imaging hundreds of individual organoids revealed heterogeneous apoptosis after exposure to iPSC-derived NK cells. A small fraction remained non-apoptotic during observation, including organoids contacted by NK cells.
Measuring Responses Below the Level of a Whole Culture
Researchers at the New York Stem Cell Foundation Research Institute and Stevens Institute of Technology developed a live-imaging assay for ovarian cancer organoids co-cultured with natural killer cells. Their npj Precision Oncology study followed individual organoids rather than reporting only an average killing signal. It revealed differences both between the two patient-derived lines and among structures within each line.
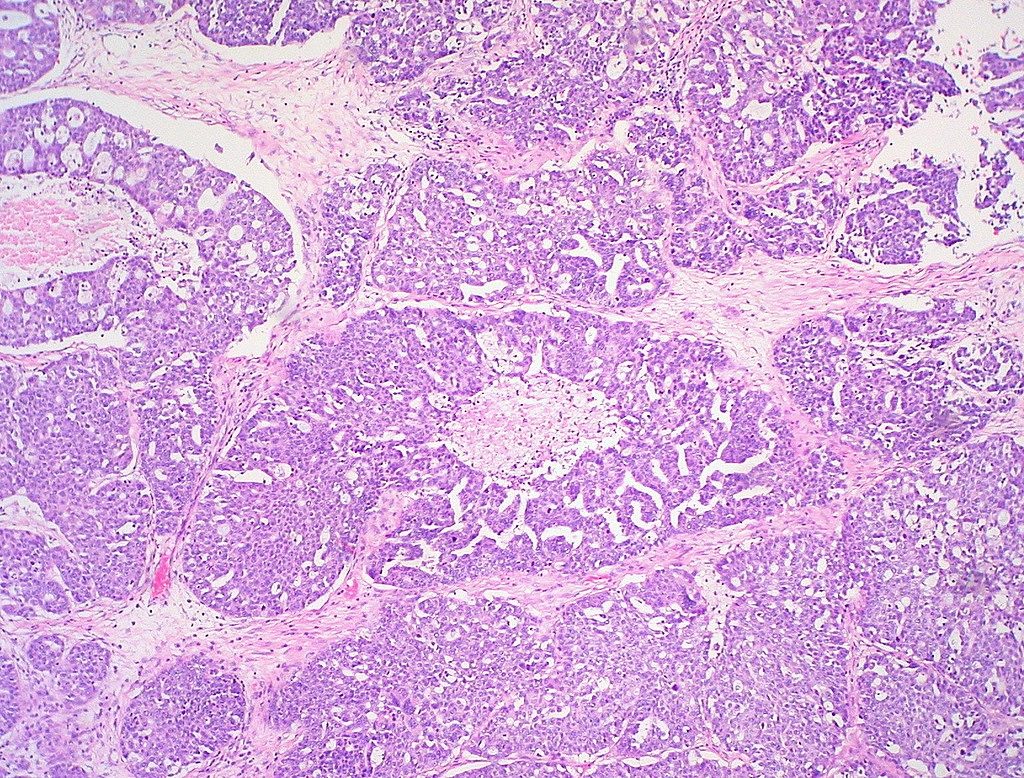
One organoid line came from a high-grade serous ovarian cancer metastasis in the omentum; the other came from an ovarian mucinous carcinoma. Histology and sequencing supported their relationship to the source tumors. The reported concordance was 80% for gene copy-number alterations and 100% for single-nucleotide variants within the selected ovarian cancer genomic signatures evaluated.
The NK cells were generated from one induced pluripotent stem cell line. Ten independent differentiation rounds supported reproducible marker expression, with more than 90% CD45-positive, CD56-positive cells. Separate K562 leukemia-cell assays showed that cryopreserved NK cells retained killing activity comparable to freshly differentiated cells.
Co-Culture Conditions Needed to Support Both Partners
Media optimized for one cell population did not automatically support the other. Pure organoid medium reduced the proportion of CD45-positive, CD56-positive NK cells after 24 hours, while pure NK medium reduced viability in the first organoid line. A 1:1 mixture maintained both organoid lines and the NK population over the relevant observation period.
The imaging assay combined 30,000 NK cells with 1,500 organoid units per well, equivalent to 20 NK cells per organoid unit, in mixed medium containing 5% basement membrane extract. Organoids and NK cells received different fluorescent labels, and a caspase-3/7 reagent reported apoptotic activity.
Images were acquired every 15 minutes for up to 11 hours. Automated analysis measured the proportion of each labeled organoid’s area positive for activated caspase-3/7. More than 500 individual organoids could be followed simultaneously per condition, with three independent imaging experiments for each patient line. Parallel organoid-only cultures helped distinguish immune-associated apoptosis from effects of labeling and culture conditions.
A Small Non-Apoptotic Fraction Persisted During Observation
Apoptotic signals increased over time in the NK co-cultures, with different response kinetics between the two patient lines. Individual organoids within the same line also varied substantially. By five hours, more than 75% showed apoptotic events, while more than 90% of organoids in monoculture controls remained alive throughout the assay.
The investigators fitted a two-component Bayesian Beta mixture to the endpoint distribution of apoptotic area. An inferred threshold of 8.6% separated lower-signal and apoptotic groups for the time-course analysis. A Gompertz model best described the rise and subsequent plateau in the fraction responding.
That kinetic model estimated a combined non-apoptotic fraction of 6.2%, with a credible interval of 4.9–7.5%. The estimated difference between the two patient lines was 1.4%, with a credible interval of 0.2–2.8%. Imaging also showed NK cells contacting organoids with little or no apoptotic signal, supporting a response difference beyond simple failure of immune cells to reach every structure.
Size Was Associated with Response but Did Not Explain It
Non-apoptotic organoids were enriched among smaller structures at the endpoint, with an odds ratio of 3.64 and P < 2 × 10⁻¹⁶. Apoptotic organoids nevertheless occurred in both size groups. The relationship between diameter and apoptotic area also differed between the patient lines, so size alone could not identify the low-response population.
The assay provides a way to recover the timing and distribution of immune responses that a bulk endpoint would compress into one value. Its evidence comes from two patient-derived lines and one iPSC source for NK cells. The small fraction without detectable apoptosis during the assay is a candidate for further isolation and characterization; its persistence in this observation window does not establish long-term resistance or predict a patient’s clinical response.