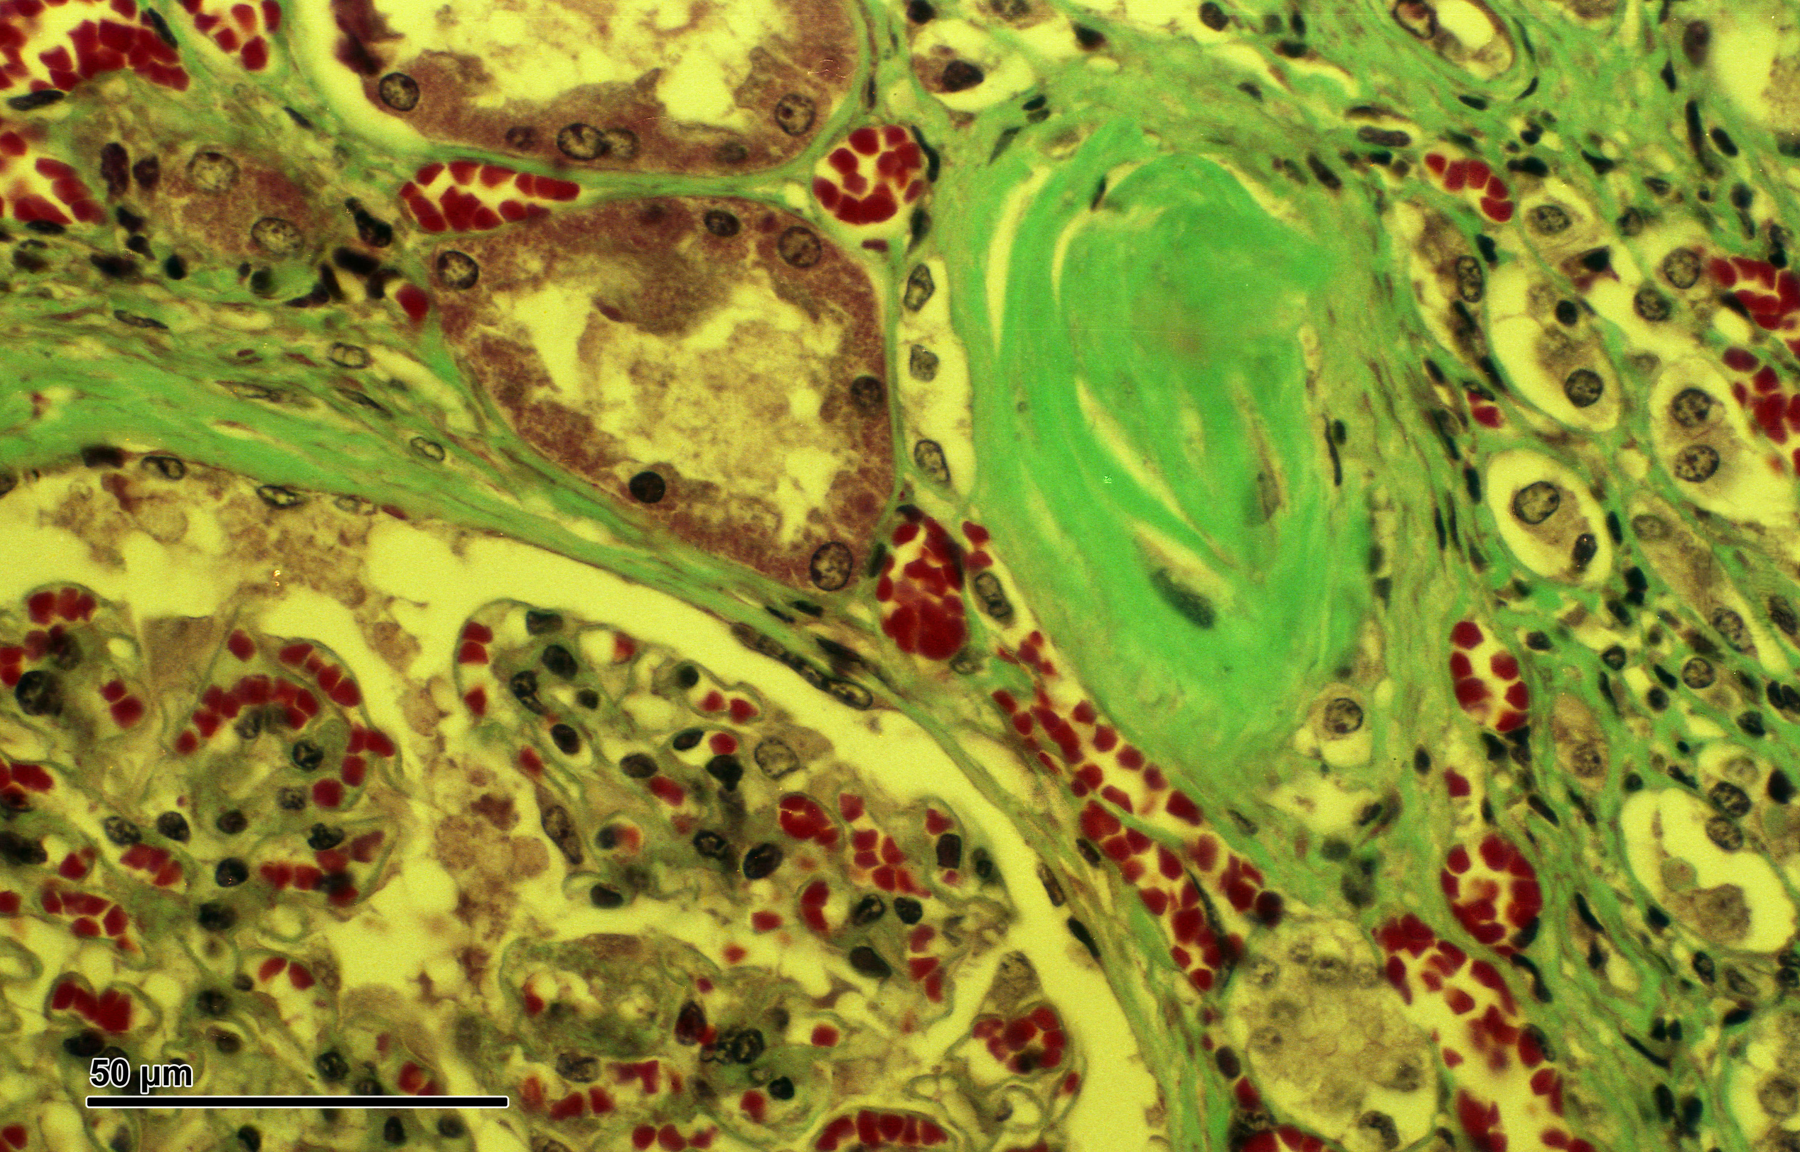
Test cyst-growth inhibition in endogenous human ADPKD backgrounds and connect drug responses with ciliary and Rho/polarity signaling.
Model & Design
Adult renal cortex-derived multi-lineage organoids and patient ADPKD cyst-wall organoids; PKD1/PKD2 discovery lines and additional donor-derived lines.
Experimental Format
96-well cyst imaging after forskolin induction, followed by concentration-response, withdrawal and pathway/proliferation comparisons.
Model Components
Component
Tissue and expansion
Description
69 normal-tissue lines established from 76 samples. Retinoic acid, GDNF and FGF20 supplemented expansion. PKD cultures lose cyst-forming efficiency/viability with extended passage.
Component
Screen conditions
Description
3,000 cells/well; 10 μM forskolin for seven days before drug. 160 compounds at 10 μM in two discovery lines, triplicate; 23 candidates retested at 0.1, 1 and 10 μM in three additional lines for seven days.
Component
Targeted follow-up
Description
ML141 at 30 μM for ten hours followed by withdrawal; 48-hour EdU comparison with ML141, CCG-1423 and EHT1864. Separate microfluidic flow 100 μL/min versus static cultures.
Measurements & Endpoints
Cyst diameter and growth change
Cell viability and EdU-positive fraction
Cyst-response reversibility
Rho/planar-cell-polarity transcripts and proteins
Ciliary and VANGL2 localization
Analysis
Cyst diameter and growth responses are compared with matched vehicle/forskolin controls and across genotypes. Establishment, genotyping and screening use different line subsets. The publication describes both a seven-day drug screen and a separate 48–72-hour cyst-quantification workflow.
Published Evidence
Study Design
Two-line discovery, three-additional-line dose-response and selected normal-versus-PKD withdrawal/proliferation comparisons.
Study Sample
Two discovery lines (PKD_021/PKD_022); three additional donor lines; at least five organoids per secondary condition. The larger genotyped collection contained ten lines.
Comparison
Vehicle/forskolin, PKD1 versus PKD2, normal organoids, static versus perfused culture and drug withdrawal.
Finding
ML141, EHT1864 and CCG-1423 reduced cyst growth across both genotypes; tolvaptan/GSK2193874 favored PKD1 and AICAR/verteporfin favored PKD2. ML141 shrinkage was reversible; normal morphology remained stable and 48-hour EdU changes were nonsignificant.
Interpretation & Limits
The published cyst-quantification workflow describes a 48–72-hour ≥ 30% growth-reduction hit criterion, whereas Figure 7 and the screening methods describe seven-day drug treatment.
Finite useful passage range and no definitive lineage tracing of all cyst origins.
Short-term morphology, viability and proliferation measurements leave chronic tissue responses, vascular and immune effects, and systemic metabolism unresolved.
Adult kidney organoids supported a 160-compound screen across PKD1 and PKD2 backgrounds. Rho-pathway inhibitors reduced cyst growth in both, while several other drugs showed genotype-dependent responses; ML141 caused reversible shrinkage without a significant change in EdU labeling.