Treat rapidly generated glioblastoma organoids with the patient’s clinical CAR-T product and compare cytolysis, antigen changes and cytokines with paired clinical measurements.
Brain & Neural ModelsOrganoids
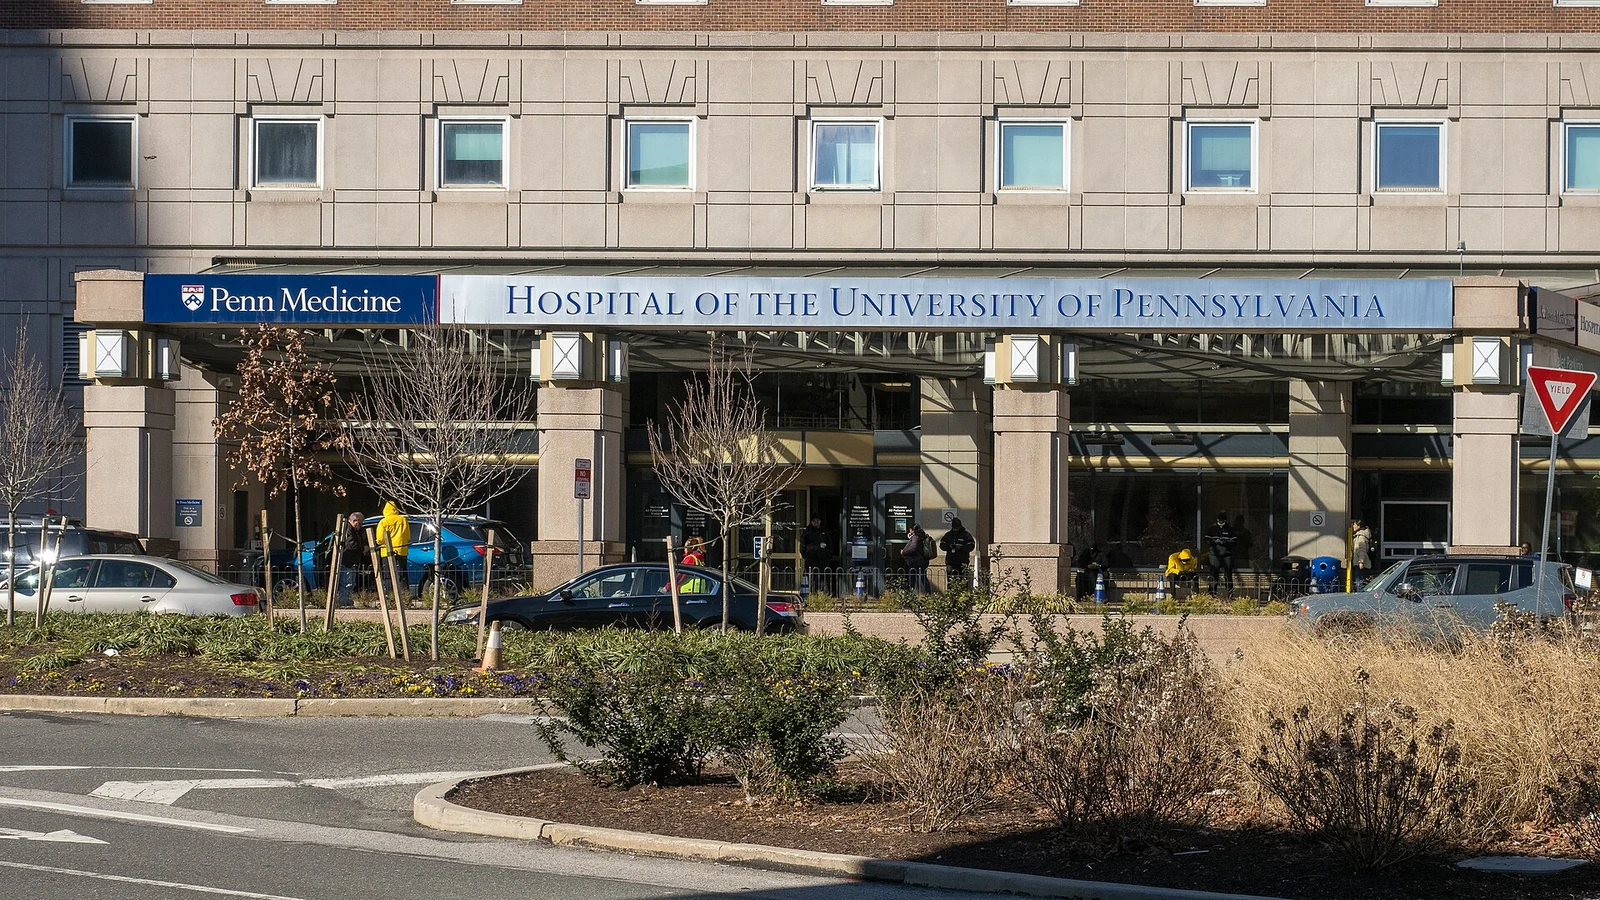
Hospital of the University of Pennsylvania, photographed in March 2024. (ajay_suresh, CC BY 2.0)
Research Applications
Investigate clinical-product bioactivity in parallel with a trial and generate hypotheses about antigen selection and CAR-T activation.
Model & Design
Six recurrent-glioblastoma organoid sets and the same patients’ autologous EGFR/IL13Rα2 CAR-T products. A seventh off-trial patient supplies untransduced and CD19-directed control material.
Experimental Format
Fresh-tissue organoids develop over two to three weeks. Two-day impedance-plate adherence precedes coculture at an estimated 1:10 CAR-T-to-tumor-cell ratio, with minute-resolved recording for six days and daily conditioned-medium collection.
Model Components
Component
Response measurements
Description
Axion Maestro impedance platform with untreated/full-lysis controls; cleaved-caspase-3, Nestin/CD3, Ki-67, Granzyme B and CD69 staining.
Component
Clinical and antigen comparisons
Description
Patient CSF CAR-copy abundance; EGFR806/IL13Rα2 flow cytometry in five patients; IFNγ, TNFα and IL-2 medium ELISA with paired CSF measurements.
Measurements & Endpoints
Six-day normalized organoid cytolysis
24-hour cytolysis versus peak CSF engraftment
Apoptosis and CAR-T activation
Five-patient target-antigen fractions
Daily cytokine time courses
Analysis
Distinguish patient-level denominators from organoid/technical replicates and clinical CAR-T engraftment from tumor control. Antigen loss in organoids does not establish post-treatment antigen status in patient tumors.
Published Evidence
Study Sample
Six paired treated patients. Main Figure 1 uses at least 12 treated and six control organoids per patient; apoptosis assays four to six organoids per condition. Antigen analysis uses five patients with four organoids each; cytokine technical replicates are at least two.
All six paired organoid sets showed cytolysis; the 24-hour response correlated with peak CSF CAR-T engraftment. Double-antigen-positive fractions declined in the five-patient analysis. Cytokines showed early peaks with no significant organoid/CSF concentration differences through day 4; this does not establish equivalence.
Interpretation & Limits
Small exploratory cohort and assay-specific missing samples.
The estimated effector ratio is not a measured individual in vivo exposure.
Correlative experiments were not randomized or blinded.
No prospective treatment-selection, durable-response or survival prediction validation.
Study Design
Primary study comparisons of the named models, exposures and measured outcomes.
Six patients’ glioblastoma organoids were treated with the same autologous CAR-T products used clinically. Early organoid cytolysis correlated with peak CAR-T engraftment in cerebrospinal fluid, while antigen and cytokine analyses supplied complementary ex vivo information rather than a validated predictor of clinical benefit.