Morphi Bright-Field Analysis of Tumor Model Drug Responses
A fluorescence-supervised image-analysis framework that estimates viability, spatial cell-death patterns and morphology from bright-field images of individual spheroids and organoids.
Distinguishing cytostatic from cytotoxic responses and comparing drug-response heterogeneity within and between wells.
Model & Design
A2780 ovarian cancer cell-line spheroids for training; additional assessment in WM0014 patient-derived gastric cancer organoids and existing multimodel screening images.
Experimental Format
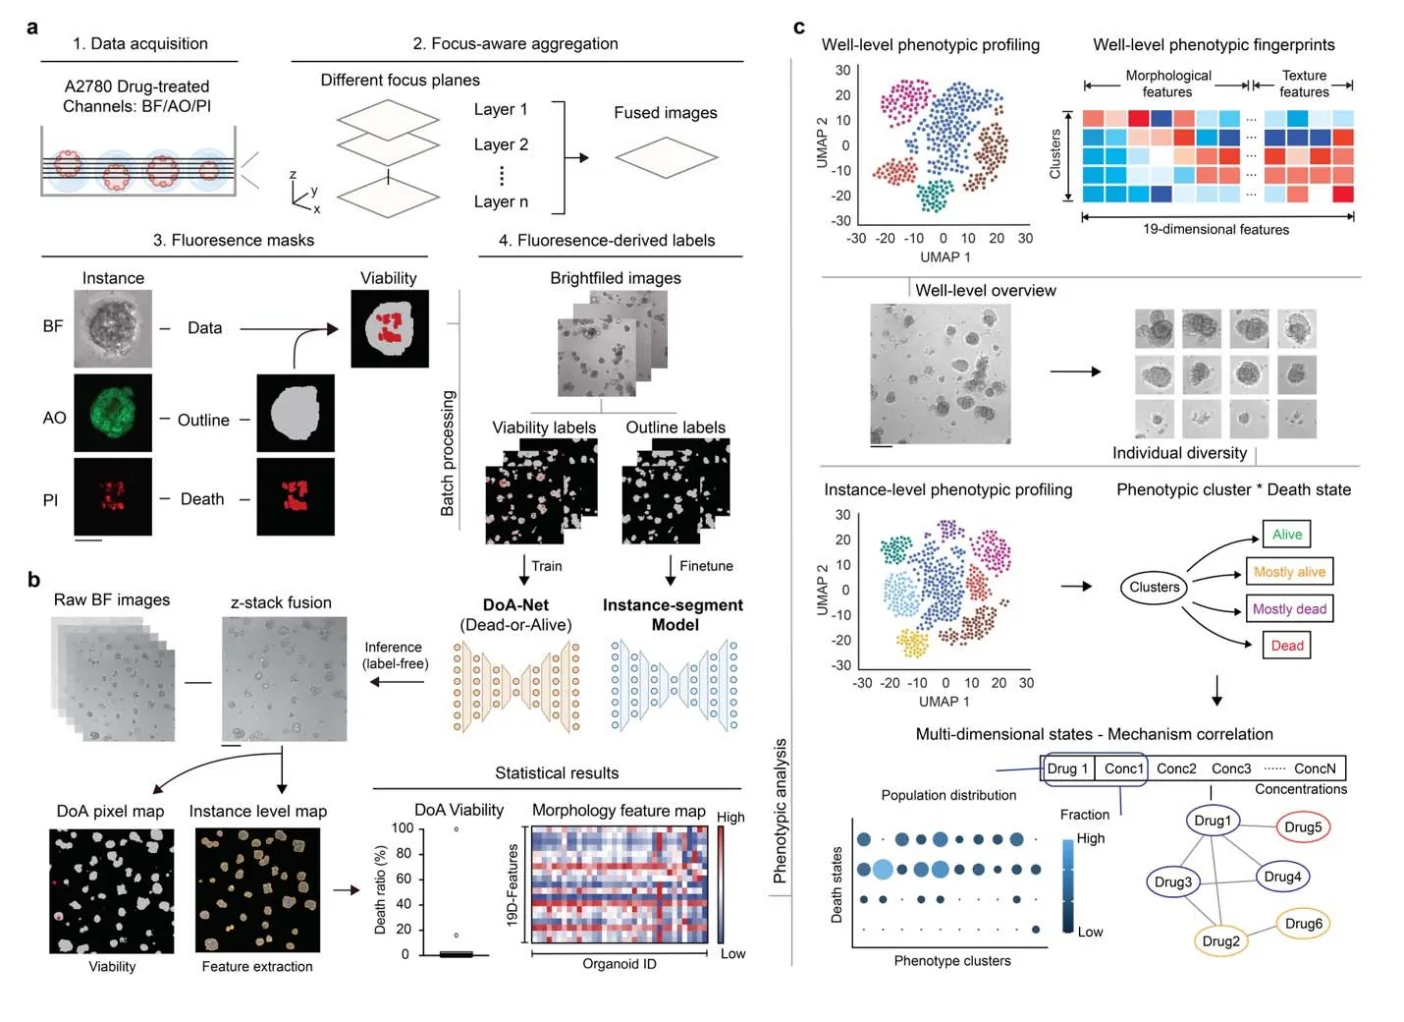
A 24-compound dilution series with three-day exposure and matched bright-field, boundary-fluorescence and propidium iodide (PI) death-marker images. Fluorescence supplies training labels; trained-model inference requires bright-field images.
Model Components
Component
Image training and inference
Description
Focus-enhanced projections, fluorescence-derived weak masks, instance segmentation and DoANet pixel-level viability predictions produce per-object viability and spatial death maps.
Measurements & Endpoints
Viable fraction and spatial death map for each segmented object
Morphology and texture descriptors
Dose–response curves and phenotypic similarity between drugs
Analysis
Aggregate per-object predictions to wells; compare dose–response curves with AO/PI fluorescence and CellTiter-Glo; combine morphology clusters with predicted death states to describe drug-response fingerprints.
Published Evidence
Study Design
Independent dilution-series repeat in A2780, comparison with fluorescence and ATP readouts, and transfer to previously unseen organoid images.
Study Sample
The initial dataset contained 1,510 multichannel stacks and more than 23,000 valid objects. After filtering, 6,897 instance images were split 80:20; the image test set contained 1,380 objects. Broader assessment included WM0014 and a 5,634-compound screen across ten tumor organoid models.
Comparison
AO/PI fluorescence, CellTiter-Glo and two independently prepared dilution screens. Dose–response correlations were calculated across the drug dataset rather than as image-test-set classification scores.
Finding
Dose–response AUC correlations were r = 0.95 with fluorescence and r = 0.97 with CellTiter-Glo; repeat-screen correlation was r = 0.91. Some drugs inhibited growth without proportionate death signals.
Interpretation & Limits
The study is a preprint. Training uses fluorescence-derived weak labels, and performance can vary between biological models.
Morphological similarity describes a response pattern; it does not identify a shared molecular target.
A Westlake University team trained an image-analysis framework with fluorescence-derived labels, then used bright-field images to estimate viability and death patterns. A 24-compound A2780 screen revealed responses that bulk ATP measurements alone did not distinguish.