From Single Organoids to Drug Concentrations
Researchers at Heidelberg University assembled three-dimensional blood–brain barrier organoids from the human cerebral microvascular endothelial cell line hCMEC/D3, primary pericytes and primary astrocytes. They chose day 3 after assembly for the main measurements after examining organoid architecture, endothelial coverage and cell death.
The three cell types gave the construct several components of the neurovascular interface. Imaging showed an endothelial surface, astrocyte processes in contact with endothelial cells, and proteins associated with junctions and barrier function, including ZO-1 and P-glycoprotein. The authors used these structural checks when selecting the measurement window.
The paracellular control had an initially counterintuitive readout. Loosening cell connections reduced the amount of the water-soluble marker left in the organoids after processing, consistent with the marker washing out more readily through a disrupted barrier. The authors compared this behavior with a lipid-soluble cell stain and an extracellular fluorescent marker. These controls helped explain why less retained marker could accompany greater leakiness; the residual signal was not a simple measure of entry alone.
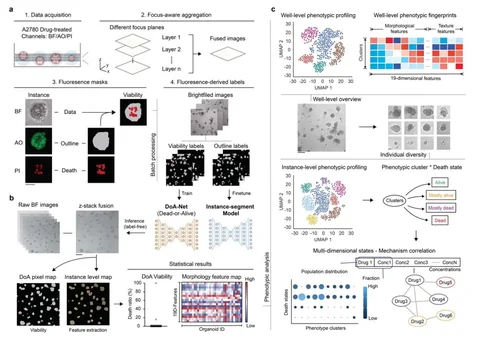
The team then quantified drug in individual organoid lysates by ultra-performance liquid chromatography–tandem mass spectrometry (UPLC-MS/MS). They assessed 13 drugs across concentrations and exposure times, estimated each organoid’s internal concentration from its lysate measurement, and calculated uptake ratios against the corresponding incubation concentration. Distinguishing retained drug from external carryover and analytical background was necessary because each organoid contained only a small amount of compound. The time- and concentration-dependent measurements helped identify a suitable uptake comparison. Octreotide was at background level in the organoids and did not enter the logarithmic correlation analysis.
A Correlation with a Mixed Reference Set
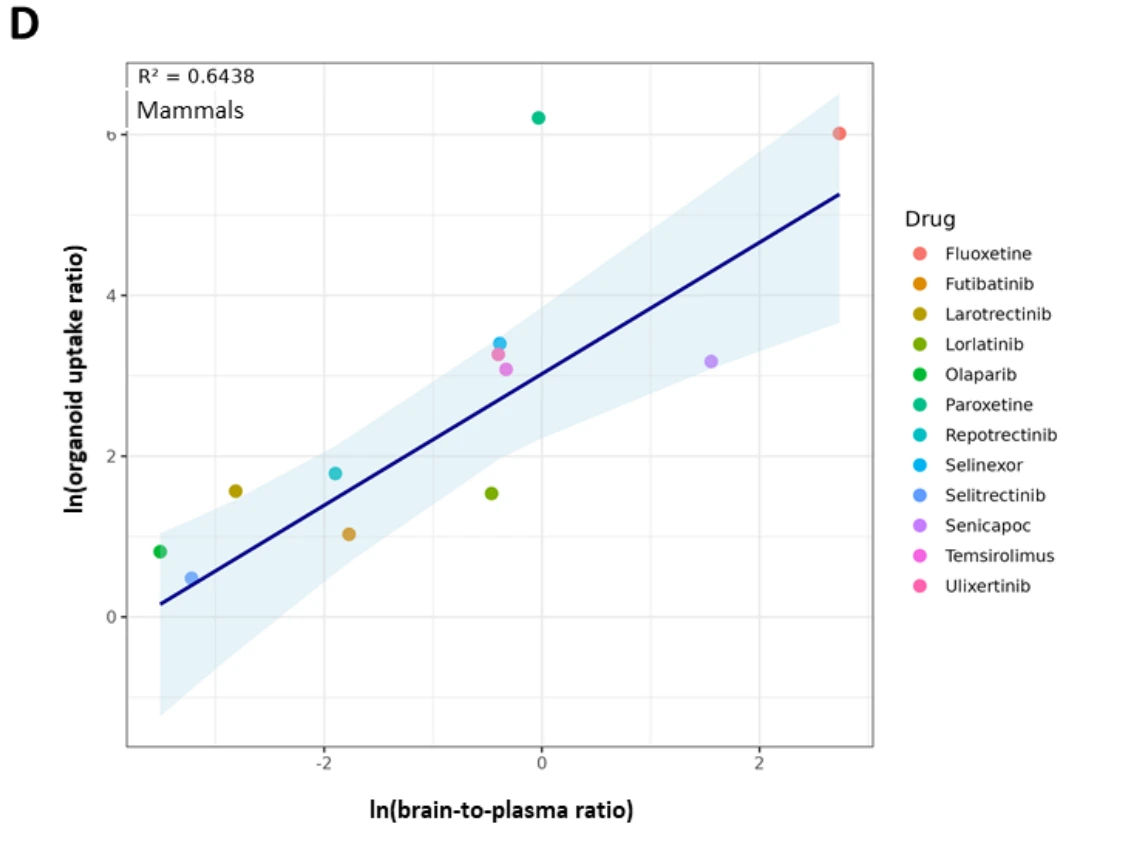
For the remaining measurable drugs, the authors compared steady-state organoid uptake ratios with brain-to-plasma ratios collected from published mammalian studies. Deming regression gave a pseudo-R² of 0.64 for the combined reference set. Analyses limited to primate or human reports gave pseudo-R² values of 0.81 and 0.82, respectively, using the reference measurements available for different subsets of drugs. Four computational permeability tools assessed against the same available reference data did not show a comparable correlation in this study.
Those subsets were not a matched series in which every drug had been measured in every species. The coefficients therefore describe different reference comparisons, not a clean ranking of the organoids’ predictive performance across species.
Reference Data and Model Variability
Published reference ratios combine different species, tissues, sampling times and measures of bound or unbound drug. The organoids also lack blood flow and showed substantial between-organoid variation. These sources of variation affect how precisely organoid uptake can be related to brain exposure.