
Preprint Links MDM2 Expression Programs to Colorectal Organoid Morphology and Drug Data
A version 2 preprint relates MDM2 promoter-associated programs to organoid morphology and reanalyzes nutlin response. Patient-adjusted morphology and TP53-adjusted organoid drug associations retain important statistical limits.
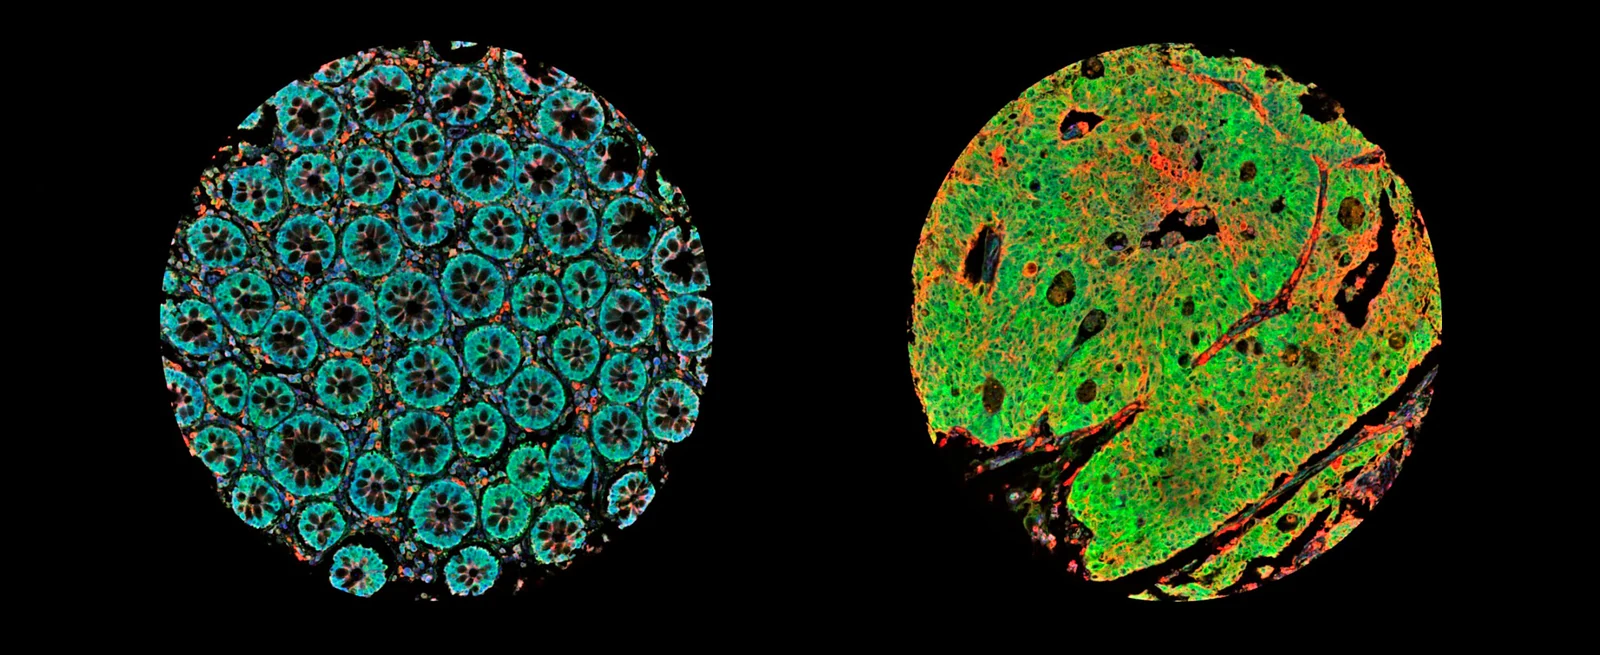
An Exploratory Axis Across Images, RNA and Drug Data
Researchers at the University of Tokyo and collaborating Japanese institutes reanalyzed colorectal cancer organoid images and transcriptomes to examine MDM2 promoter-associated programs. The preserved source is version 2 of a bioRxiv preprint, posted on September 29 after its first posting on September 26. It connects morphology with molecular signatures and separately examines existing drug-response datasets.
The discovery collection comprised 63 organoid specimens from 22 patients, including primary tumors and several metastatic sites. Multiple specimens could therefore come from one person. The analysis used 792 images, exon-level transcriptome arrays and TP53 annotations. The central question was whether compact glandular and cystic–mucinous morphologies corresponded to different MDM2-related expression programs.
Morphological Correspondence Is Stronger at the Specimen Level
A classifier based on VGG16, a convolutional image network initialized with ImageNet-pretrained weights, recognized three manually assigned morphology categories with 98.5% test accuracy, or 64 of 65 test images. Training and test images were randomly separated at image level, with no patient or specimen blocking. The authors identify possible within-patient correlation, a small test set, subjective labels and lack of external imaging validation as limitations on that performance estimate.
P1-dominant specimens had a median compact-glandular image fraction of 0.826, compared with 0.444 in P2-dominant specimens. The specimen-level difference had P = 1.1×10⁻3, but a mixed model accounting for patient identity gave P = 0.093. The 13 P2-dominant specimens came from only six patients. A morphology-based AUC of 0.79 described identification of those specimens within this exploratory dataset.
The P1-associated expression program emphasized intestinal identity, absorption/metabolism and proliferation. The P2-associated program included gastric/Paneth-like differentiation, mucins, stress responses and p53 targets. Coordinated 15q11–q13/SNORD116-locus expression also appeared in the discovery organoids, but its status as a P2 subtype feature was not reproduced in bulk-tumor datasets. These observations describe co-occurring programs; the study did not experimentally switch promoters to show that promoter choice caused the morphology.
Promoter Usage and Downstream Signatures Are Distinct Measurements
The researchers examined derived signatures in 624 colorectal tumors from The Cancer Genome Atlas (TCGA) and 519 tumors from GSE39582. Signature distributions differed across consensus molecular subtypes, and the primary P2 score, which excluded immune-checkpoint genes, was higher in mismatch-repair-deficient tumors. Removing the immune module addressed the different contribution of infiltrating immune cells in bulk tissue.
A separate transcript-level P2_index directly estimated the fraction of MDM2 transcripts using P2. This measure tracked TP53 status and showed a gradient from truncating mutations through missense mutations to wild type. Its association with overall survival was absent, and the P1 signature did not add independent prognostic information after adjustment for stage. Direct promoter usage, downstream p53 output and a broad P2 signature therefore require separate interpretation.
Measured Organoid Drug Response Leaves an Independent Association Unconfirmed
The pharmacology component included a reanalysis of 65 colorectal organoid lines from an independent public dataset. Seventeen TP53 wild-type lines were more sensitive to nutlin-3 than 48 mutant lines, with P = 7.4×10⁻8. A P2-related score was associated with sensitivity, but after TP53 adjustment its partial correlation was −0.331, with raw P = 0.0071 and false-discovery rate 0.056. The analysis did not establish a corrected association independent of TP53 status.
Measured cell-line data supplied a different result: the P2 score retained a small association with Nutlin-3a sensitivity after cancer-type and TP53 adjustment. P1 scores weakly tracked sensitivity to ATR, CHK1 and WEE1 inhibitors. These effects were exploratory, and the 44 colorectal cell lines alone were insufficient for significance. Only nutlin-response data were available for the independent organoid analysis.
The authors also predicted drug sensitivity in TCGA tumors from cell-line pharmacogenomics. Nutlin-3a ranked highly, but many other drugs correlated with the P2 score, and that score contains canonical p53 targets. These predictions were not patient treatment measurements. An immune-checkpoint-response prediction likewise failed to reproduce within the subset with microsatellite-instability annotations.
The discovery analysis remains mainly bioinformatic, with repeated specimens and exploratory signature construction. The authors plan functional experiments to test whether changing MDM2 promoter usage alters morphology, followed by prospective validation of the proposed classification. The independent organoid analysis currently leaves the TP53-adjusted drug association unconfirmed after correction.