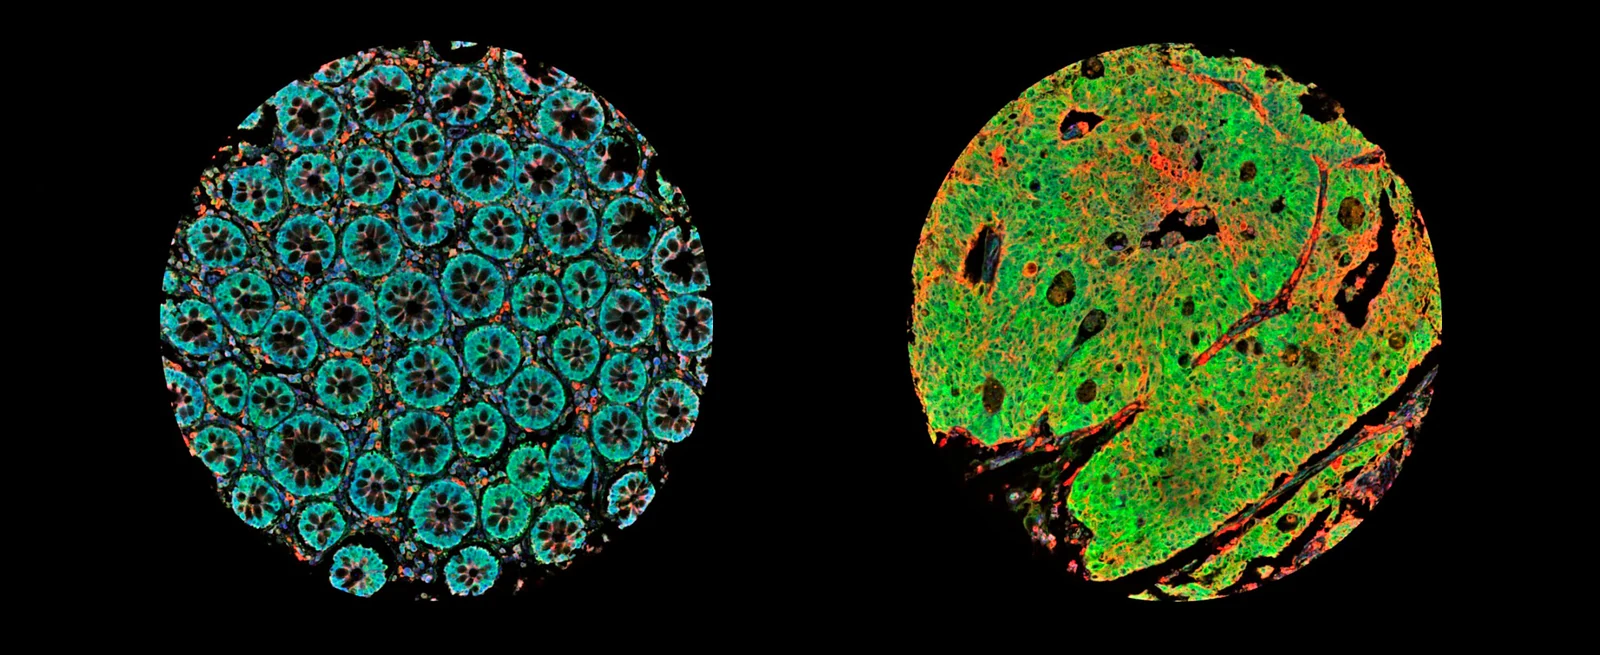
Explore whether a promoter-associated expression axis adds drug-response information beyond TP53 status.
Model & Design
63 organoid specimens from 22 colorectal cancer patients for discovery; independent public nutlin data from 65 colorectal cancer organoid lines, including 17 TP53 wild-type and 48 mutant lines.
Experimental Format
Image classification, exon-level/isoform analysis and signature scoring; reanalysis of measured organoid response, cell-line measurements and predicted tumor sensitivity as separate evidence layers.
Exon-based Splicing Index, downstream P1/P2 signatures and directly quantified transcript-level P2_index, kept as distinct measures.
Component
Drug data
Description
Public nutlin-3 organoid IC50 data and GDSC2, a measured cell-line drug-sensitivity dataset; bulk-tumor drug-response estimates generated with oncoPredict, an R package that predicts tumor drug response from cell-line screening data.
Measurements & Endpoints
Morphology fraction versus isoform group
P2 signature versus measured nutlin sensitivity
TP53-adjusted association and FDR
External tumor expression associations
Analysis
Account for repeated specimens within patients and retain correction for multiple testing. Interpret measured IC50 separately from model-derived tumor sensitivity and expression-group associations.
Published Evidence
Study Design
Reanalyze independent organoid nutlin response and ask whether P2 signature association persists after TP53 adjustment.
Study Sample
65 independent colorectal cancer organoid lines: 17 TP53 wild-type and 48 mutant. The discovery collection has 63 specimens from 22 patients.
Comparison
TP53 wild type versus mutant; unadjusted versus TP53-adjusted P2 signature associations.
Finding
Wild-type lines were more nutlin-sensitive (P = 7.4×10⁻8). The TP53-adjusted P2 association had partial rho −0.331, raw P = 0.0071 and FDR = 0.056, so independence was not established after correction.
Interpretation & Limits
The cached source is bioRxiv version 2, posted 2026-09-29; first posting was 2026-09-26.
P2 signature and direct P2_index are different measurements; neither establishes clinical treatment selection.
The image classifier used an image-level split without patient blocking.
No functional experiment switched MDM2 promoters to test causality.
A version 2 preprint relates MDM2 promoter-associated programs to organoid morphology and reanalyzes nutlin response. Patient-adjusted morphology and TP53-adjusted organoid drug associations retain important statistical limits.