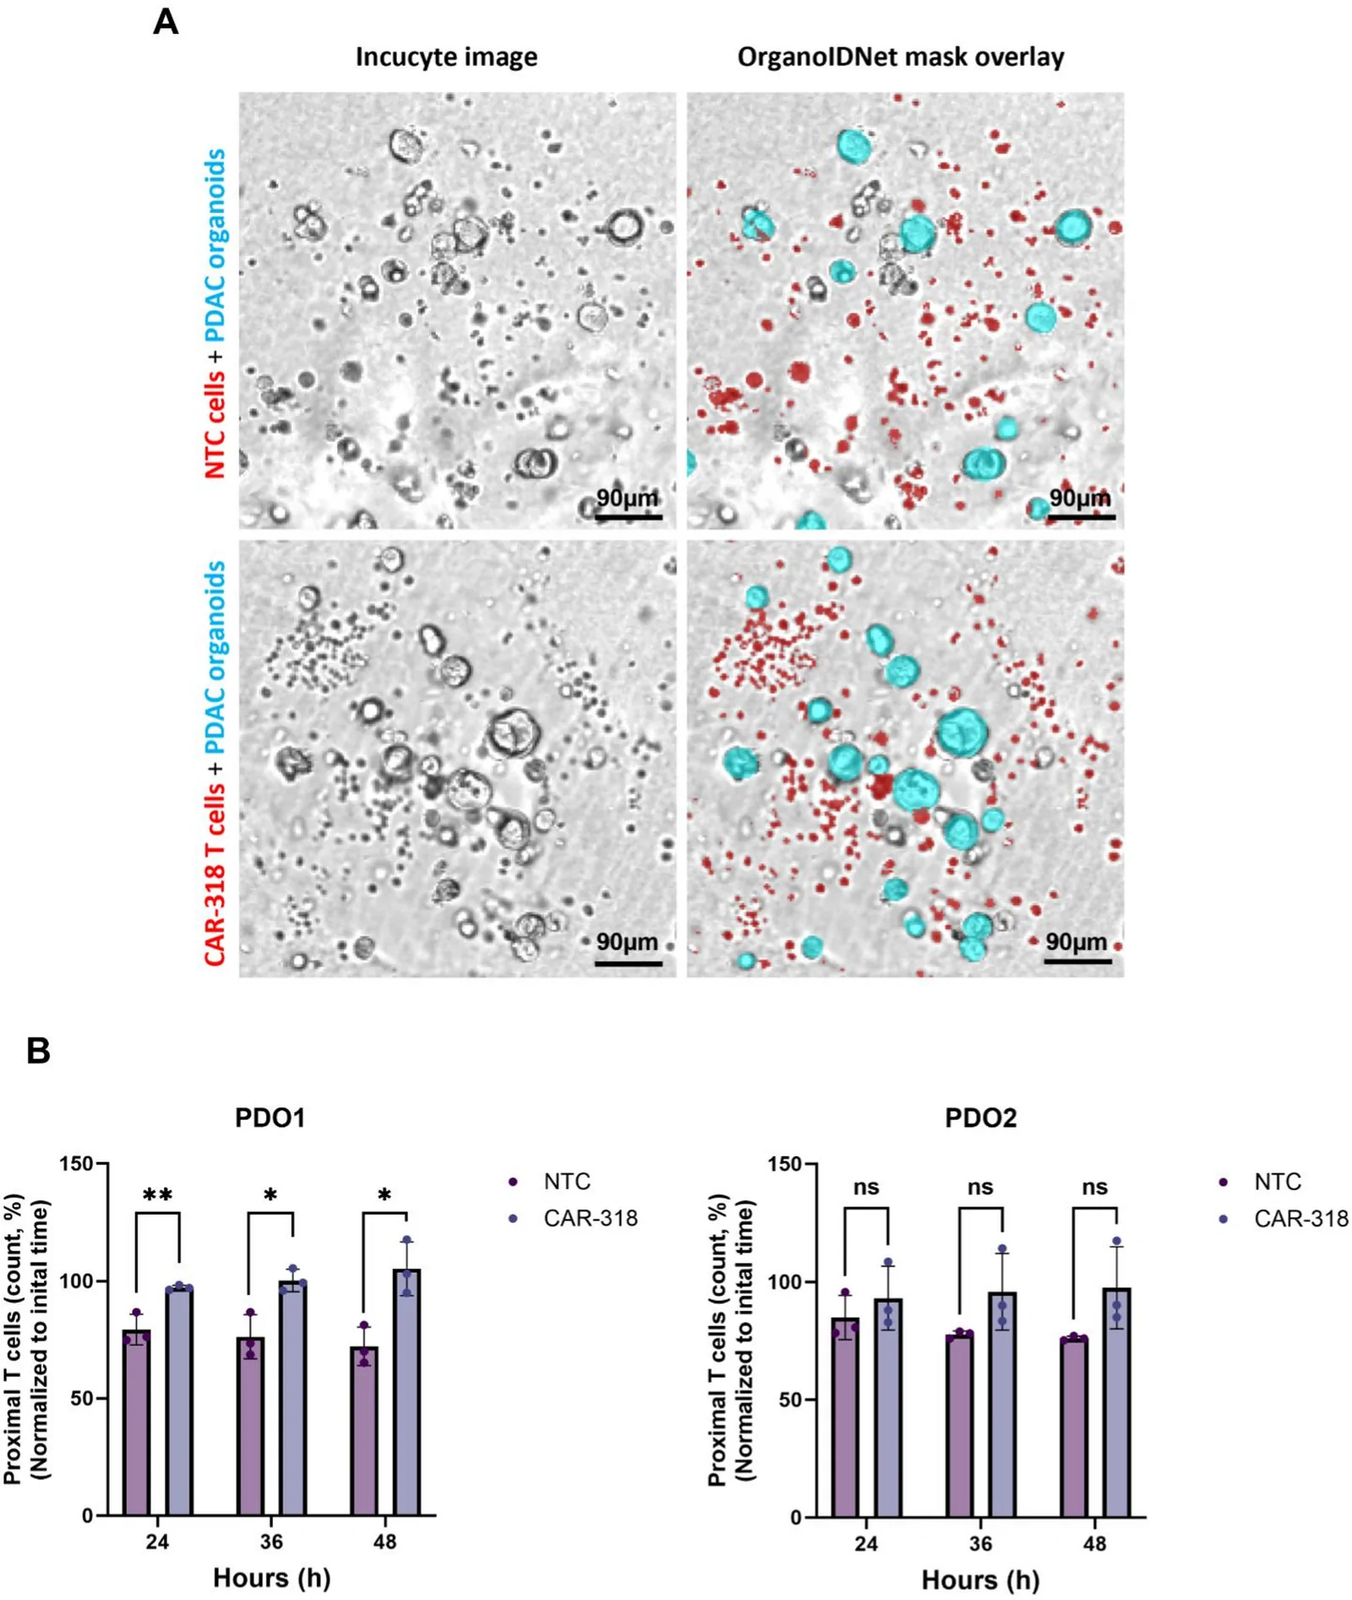
Image segmentation and nearby T-cell measurements in pancreatic organoid cocultures with CAR or control T cells. (Ferreira et al., Journal of Translational Medicine, 2026, Figure 3 , CC BY 4.0 ) Research Applications Compare candidate CAR-T activity across patient-derived pancreatic cancer organoids.
Model & Design Seven PDAC organoids with healthy-donor CAR or nontransduced T cells; CD318 and TSPAN8 target comparisons used relevant subsets.
Model Components Component Tumor models
Description Patient-derived pancreatic ductal adenocarcinoma organoids in a Matrigel-based coculture.
Component Immune cells
Description CAR and nontransduced T cells from three independent healthy donors in the main comparisons.
Component Specificity controls
Description Antigen knockout cell lines and TSPAN8-positive/negative organoids.
Measurements & Endpoints Organoid count and area over time T-cell density in an external organoid neighborhood Live tumor-cell fraction by flow cytometry Analysis Interpret organoid morphology, T-cell proximity and endpoint killing as complementary measurements, with technical wells averaged within donor.
Published Evidence Study Design Repeated imaging with orthogonal functional and antigen controls.
Study Sample Two primary PDOs, four additional CD318 models and TSPAN8 organoid comparisons within a seven-model collection.
Comparison CAR T cells versus nontransduced T cells or no T cells; antigen-positive versus relevant negative controls.
Finding Main-model killing increased with effector-to-target ratio, reaching approximately 45% and 40% at 8:1 after three days.
Interpretation & Limits The T-cell neighborhood measurement describes proximity, not direct intratissue infiltration. OrganoIDNet was used for inference without retraining in this study. The short healthy-donor coculture did not assess long-term CAR-T persistence or clinical response.