
OrganoIDNet Follows CAR-T Responses and T-Cell Proximity in Pancreatic Cancer Organoids
Repeated imaging measured changes in organoid number, area and nearby T cells during CAR-T coculture. Flow cytometry and antigen controls provided complementary evidence of tumor-cell killing.
Combining Repeated Images with Endpoint Measurements
A Max Planck- and Göttingen-led academic team used the pretrained image-analysis framework OrganoIDNet to follow patient-derived pancreatic ductal adenocarcinoma organoids during CAR-T treatment. The study combined repeated bright-field imaging with flow cytometry and confocal imaging, asking when organoids changed and how T cells accumulated around them. Miltenyi collaborators contributed CAR-related materials, cell-line models and flow-cytometry work.
The collection contained seven patient-derived organoid models. CAR T cells and nontransduced control T cells came from healthy donors, rather than from the patients supplying the tumors. The initial comparisons focused on two organoids with different proportions of CD318-positive tumor cells, approximately 40% and 90%. Four additional models extended the CD318 analysis.
Cell Killing Increases with Effector-to-Target Ratio
After three days, flow cytometry showed an effector-to-target-dependent reduction in live tumor cells. Approximately 15% killing was observed at a 2:1 ratio and 30% at 5:1 in the two main models. At 8:1, the reported values were approximately 45% for PDO1 and 40% for PDO2. Nontransduced T cells did not significantly alter the endpoint viability in that comparison.
The experiments used T cells from three independent donors, with technical replicate wells averaged before analysis. The additional organoids showed variable reductions in organoid number or area, extending the assay across patient-derived heterogeneity without imposing a single response magnitude on the whole collection.
Separating Organoid Change from T-Cell Location
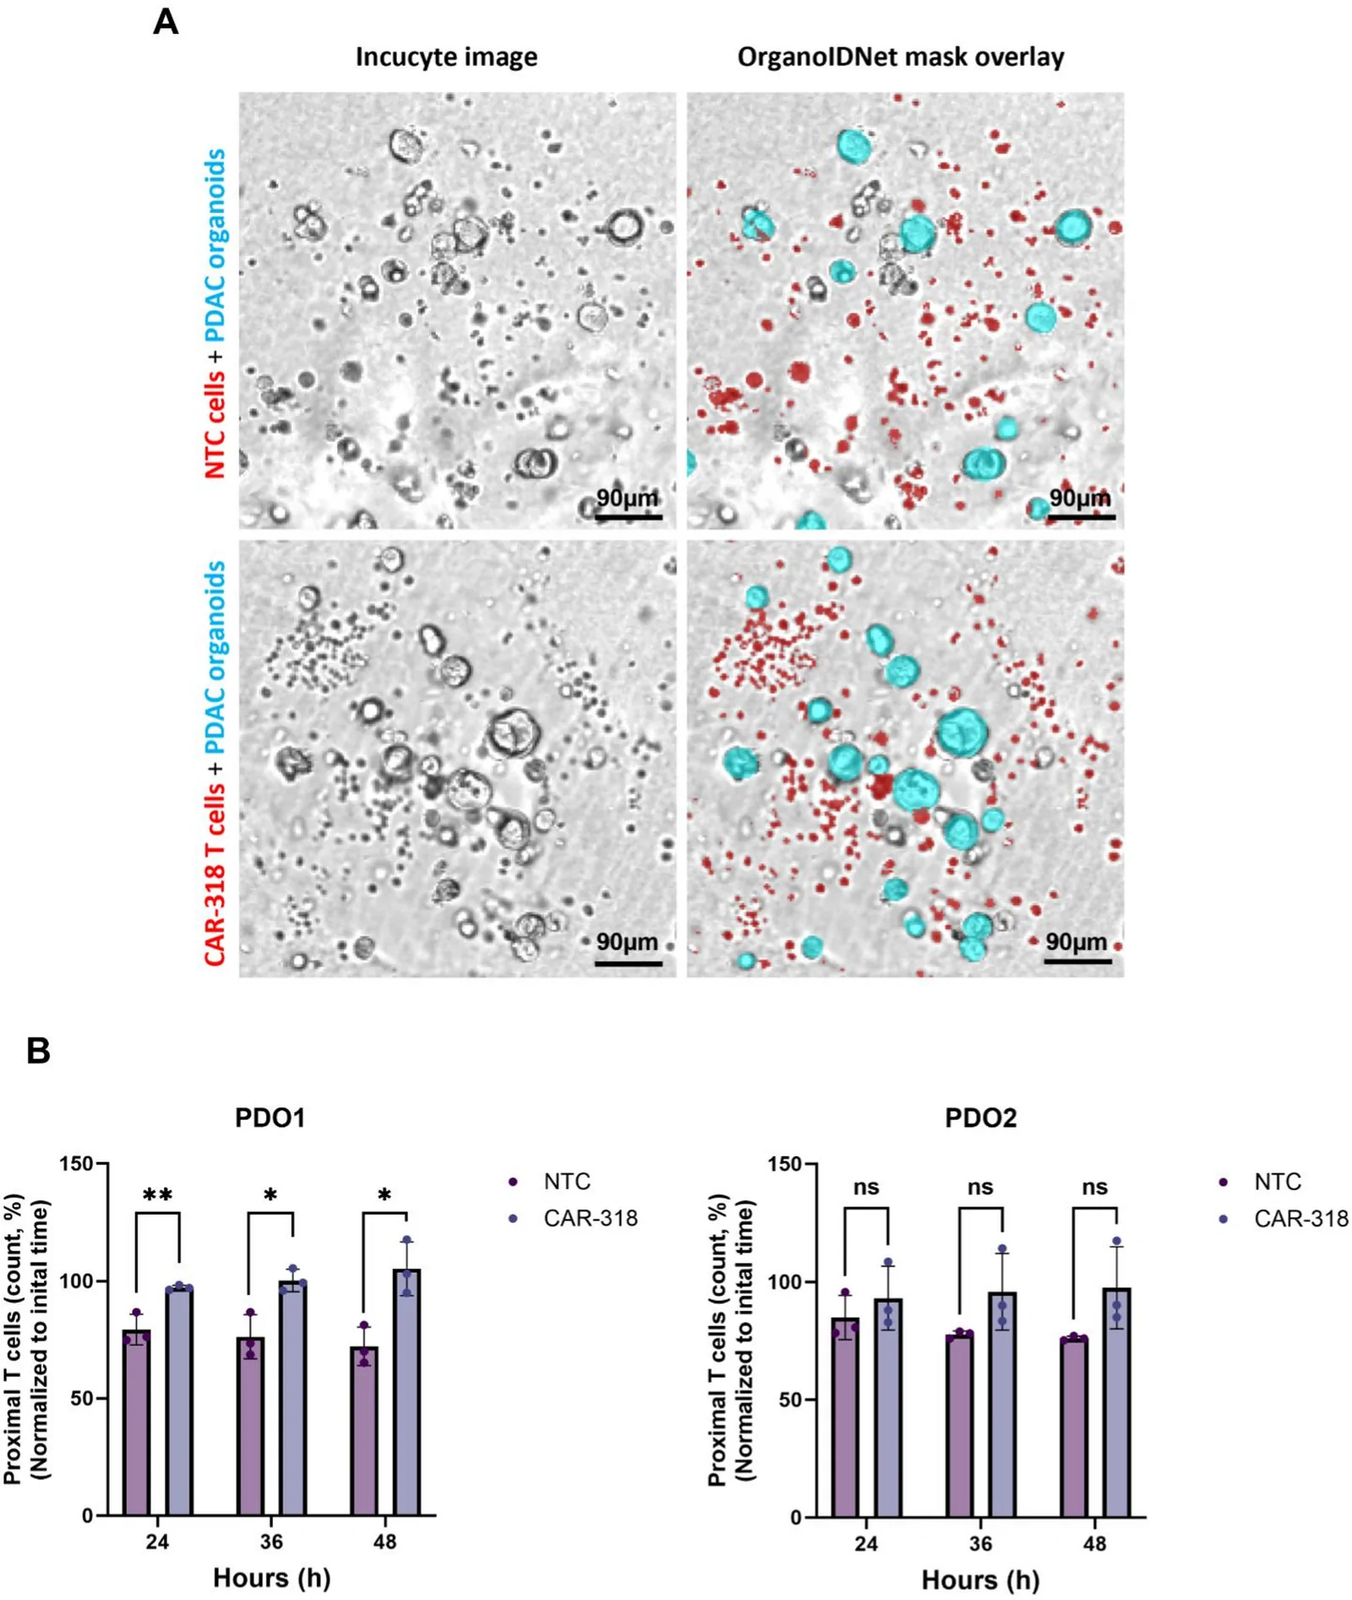
OrganoIDNet segmented the organoids in repeated Incucyte images and measured their number and area. At the highest effector-to-target ratio, PDO1 had approximately 40% fewer organoids and a 50% reduction in area after 36 hours compared with organoids cultured without T cells. PDO2 reached a roughly 50% area reduction after 48 hours.
A separate image-processing procedure detected T cells in a defined neighborhood outside each segmented organoid. CAR T cells accumulated more strongly in that neighborhood than nontransduced controls. This measure described proximity to the organoid surface. Confocal imaging supplied additional spatial observations of T-cell–tumor interactions.
The study applied an existing pretrained OrganoIDNet model in inference mode without retraining. Organoid number and area came from that model, while the T-cell proximity measurements used the separate detection pipeline.
Antigen Controls and the Scope of the Assay
CD318 knockout experiments in AsPC1 and BxPC3 cell lines supported antigen-dependent killing. All organoids in the collection expressed CD318, so a naturally CD318-negative organoid comparator was unavailable. The researchers used TSPAN8-directed CAR T cells for an additional test, comparing antigen-positive and naturally antigen-negative organoids as well as knockout cell lines.
The combined measurements distinguish the timing of morphological response, the position of nearby immune cells and the endpoint loss of live tumor cells. The study's observation window was short, and the healthy-donor cocultures lacked the full patient immune and stromal environment. Persistence, repeated tumor encounters and long-term resistance were outside the experiments reported. The work provides a human-derived assay for comparing candidate cell-therapy responses, with several complementary measurements rather than a single image-derived estimate of killing.