Hidden Net-Effect Recovery from Synthetic Chemotherapy Cell-Count Trajectories
PhINs uses an equation-constrained network to reconstruct a synthetic cell count and its hidden time-varying net-effect function.
Tumor ModelsComputational Models
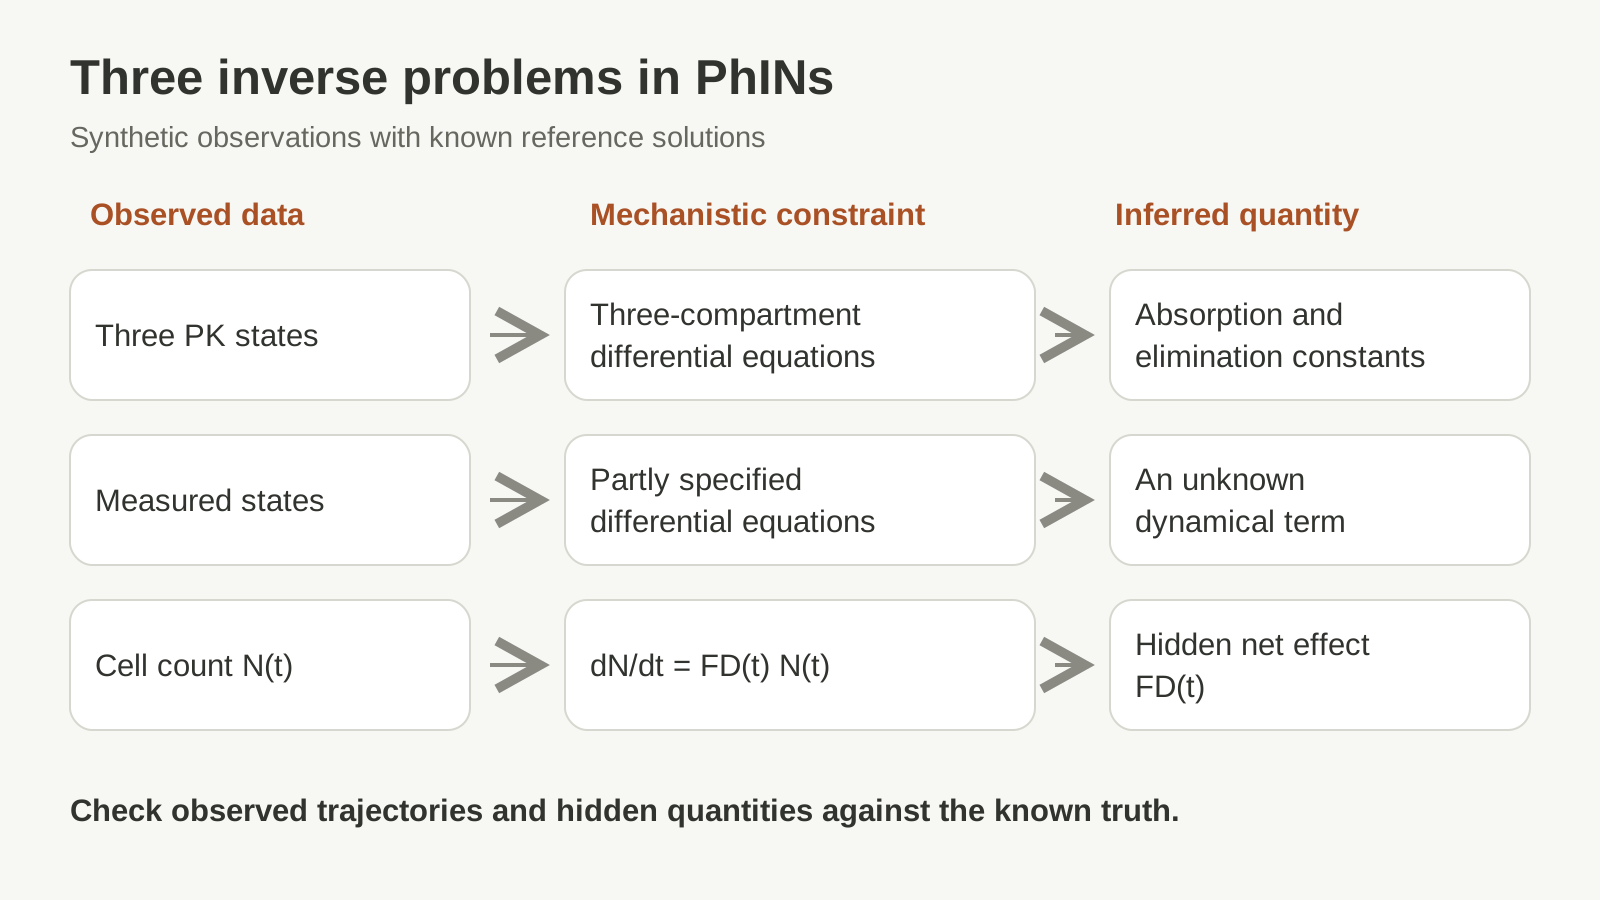
The tutorial’s three synthetic inverse problems link different observations and equation constraints to the quantities being inferred. (NAMs Insights)
Research Applications
Benchmark observed-state and hidden-function recovery in a controlled partially observed pharmacodynamic problem.
Model & Design
Example 3 synthetic cancer-cell count N(t), generated from proliferation, time-varying death and a carrying-capacity term; only N(t) is observed.
Experimental Format
Compare physics-informed multilayer perceptrons and Kolmogorov–Arnold networks with different sampling and residual-weighting schemes over a 600-hour generating interval.
Model Components
Component
Synthetic observations
Description
Known cell-count and net-function ground truth; Table 3 compares 20/120 observation settings and 0%/5% noise.
Component
Mechanistic constraint
Description
dN/dt = FD(t) N(t); physical FD equals 0.03 times the learned hidden output, with an initial-value anchor in the described loss.
Measurements & Endpoints
Cell-count RMSE
Hidden-net-function RMSE
Consistency with the generating equations and a conventional forward solution
Analysis
Evaluate the observed trajectory and hidden function separately against their known generating values. FD is the net count-change function, not an independently measured drug-killing rate.
Published Evidence
Study Design
Source-reported synthetic benchmark compares architectures and training settings; no real drug-response experiment is claimed.
Study Sample
One controlled synthetic model; Table 3 compares 20 or 120 observations with 0% or 5% noise.
Comparison
Known generating N(t)/FD(t) and the other listed network/sampling/weighting configurations.
Finding
At 120 observations/5% noise, PINN N/FD RMSE is 7.78 × 10⁻³ / 8.12 × 10⁻⁴; PIKAN is 3.89 × 10⁻³ / 4.70 × 10⁻⁴ in the reported configurations.
Interpretation & Limits
Synthetic benchmark does not validate clinical or nonclinical drug efficacy.
Parameter and function identifiability remain separate from fit quality.
Architecture rankings vary across settings; severe sparsity, irregular sampling and model misspecification are unresolved.
PhINs is an open-source library for physics-informed pharmacometric modeling. Three synthetic examples distinguish fitting observed trajectories from recovering unknown parameters and a hidden time-varying chemotherapy-response function.