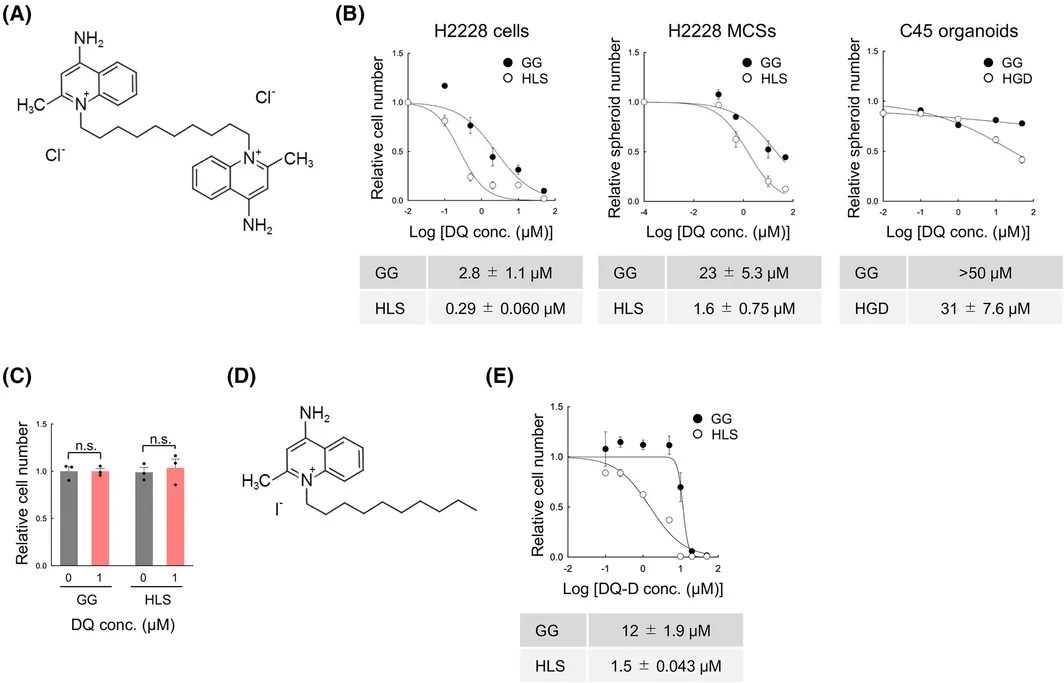
Identify activity against growth-restricted tumor cells while retaining model-specific measurements and mechanism evidence.
Model & Design
Human H2228 lung cancer monolayers and spheroids, C45 colorectal cancer organoids and WI-38 fibroblasts.
Experimental Format
General-growth conditions are compared with low-oxygen, nutrient-limited quiescent conditions appropriate to each model.
Model Components
Component
Tumor models
Description
H2228 monolayers, H2228 spheroids and one C45 organoid line.
Component
Pharmacological comparisons
Description
Dequalinium, rotenone and the lipid-peroxidation inhibitor ferrostatin-1.
Component
Cell states
Description
Matched growing and quiescent conditions within each tumor model.
Measurements & Endpoints
Model-specific concentration-response EC50
Mitochondrial membrane potential and ATP
Reactive oxygen species and glutathione ratio
Lipid peroxidation and cell-death phenotype
Analysis
Fit concentration responses separately for each state and model. Attribute detailed ferroptosis experiments to H2228 cells rather than to the C45 organoid comparison.
Published Evidence
Study Design
Within-model cell-state concentration responses with additional mechanism perturbations.
Study Sample
H2228 monolayers and spheroids; one C45 line. Drug-response curves n=5, WI-38 comparison n=3.
Comparison
Growing and quiescent states, with WI-38 and ferrostatin-1 comparisons.
Finding
Quiescent/growing EC50: monolayers 0.29±0.060/2.8±1.1 μM; spheroids 1.6±0.75/23±5.3 μM; C45 organoids 31±7.6/>50 μM. Ferrostatin-1 prevented lipid peroxidation and death in quiescent H2228 cells.
Interpretation & Limits
Live-cell counts and spheroid/organoid counts are different model-specific measurements.
The detailed ferroptosis mechanism was investigated in H2228 cells.
The labile iron pool did not increase significantly; in vivo tumor activity was not tested.
Low-oxygen, nutrient-limited tumor models were more sensitive to dequalinium than actively growing counterparts. Detailed H2228 experiments linked the response to oxidative stress and ferroptotic cell death.