Anchor cell-line tumor spheroids around platinum electrodes and compare repeated impedance measurements with biological staining and culture-age controls.
Tumor ModelsSpheroids
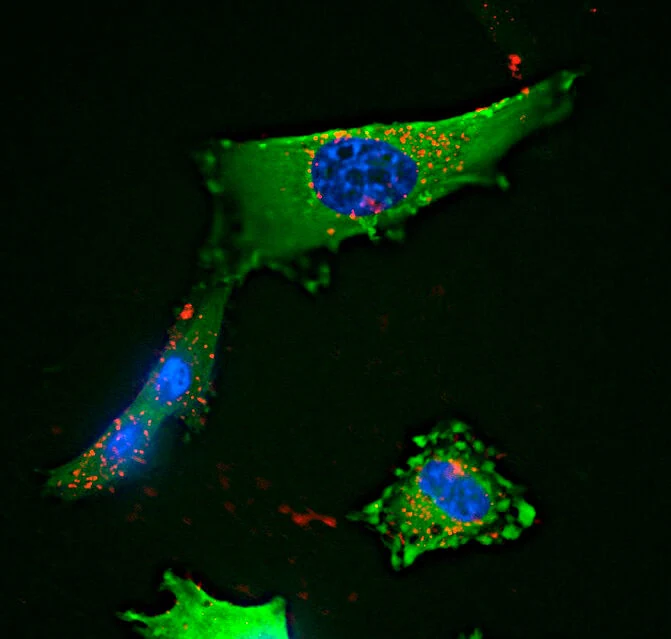
Glioblastoma cells in culture, with green fluorescent protein, blue nuclei and red internalized microspheres. (Alex Gray, CC BY 4.0)
Research Applications
Track aggregate tumor-culture responses to drugs while distinguishing maturation, detachment and cell-injury contributions.
Model & Design
GFP-expressing U-87 MG spheroids in cupola microscaffolds; a separate CaCo-2 spheroid extension. Protected integrated or external platinum reference electrode.
Experimental Format
Spheroids mature for 48 or 96 hours; nutlin-3a at 10, 15, 20 or 30 μM is assessed after 3 or 24 hours. Separate temozolomide device exposure is reported as 30 mM for 24/48 hours, whereas the separate flow assay uses 30 μM for 48 hours. CaCo-2 cultures receive 15 μM sorafenib for 3/24 hours.
Model Components
Component
Electrical interface
Description
Sixteen platinum electrodes with parylene insulation, cupola growth scaffolds and a tower-protected reference; U-87 MG seeding at approximately 35,000 cells/cm².
Component
Orthogonal measurements
Description
EthD-1 membrane-integrity staining, p53 staining and optical morphology; cell-free controls, pre-treatment values and a cell-removal comparison.
Measurements & Endpoints
Frequency-dependent impedance
Normalized cell index
EthD-1-positive and p53-positive fractions
Culture-age and necrotic-core changes
Analysis
Keep normalization and exposure conditions tied to each comparison. An early impedance decrease may include detachment and is not a single-cell viability count.
Published Evidence
Study Sample
Planar/scaffold comparison n = 16/26 electrodes; necrotic-core analysis 20 spheroids. Main statistics describe three independent experiments; the temozolomide device experiment specifies at least five devices per condition.
Comparison
Planar versus scaffold cultures; 48- versus 96-hour maturation; internal versus external reference; cell-free/untreated cultures and biological staining.
Finding
Responsive electrodes increased from 13 ± 4% to 81 ± 10%. At 3 hours, 30 μM nutlin-3a reduced impedance without significant EthD-1 or p53 increases; staining increased at 24 hours. Older spheroids retained more impedance. At 24 hours, 10/15 μM did not significantly reduce impedance in 96-hour spheroids, whereas 20 μM did. Sorafenib reduced CaCo-2 cell index by about 37% at 24 hours. The quoted percentage dispersion is standard deviation.
Interpretation & Limits
Established cell lines; no patient-response validation.
Electrical ensemble signal combines cell attachment, structure and membrane changes.
Temozolomide electrical and flow comparisons use different reported concentrations.
No equivalent-circuit or single-cell resolution.
Study Design
Primary study comparisons of the named models, exposures and measured outcomes.
A scaffold-integrated electrode array tracked maturation and drug responses in U-87 MG spheroids. Early impedance changes preceded significant staining changes after nutlin-3a, while older cultures and additional drug tests showed why electrical signals require biological and exposure context.