
BBB Classifier Study Finds Resampling Trade-offs and Descriptor-Dependent Errors
An analysis of 1,955 reference compounds compared molecular-descriptor classifiers and class-balancing methods. Random Forest performance changed modestly with resampling, while errors clustered in some descriptor groups; external chemotype validation and active transport were outside the study.
Classifying a Reference Dataset With Unequal Class Sizes
Researchers affiliated with Phillips Exeter Academy and Northwestern University compared machine-learning approaches for blood–brain barrier classification. Their analysis used the MoleculeNet BBBP reference dataset and molecular structure descriptors. The purpose was to examine prediction performance and interpretable chemical features relevant to early drug discovery.
The study analyzed 1,955 compounds, of which 1,492 were labeled BBB-permeable and 463 non-permeable. The roughly three-to-one imbalance matters because predicting the majority label for every molecule already gives 76.3% accuracy. The reported classifiers therefore need to be interpreted through their errors for both classes as well as overall accuracy.
Molecular structures were encoded with fingerprints and physicochemical descriptors calculated using RDKit, a cheminformatics toolkit. After feature filtering, 743 features remained. The paper describes a logBB threshold of −1 for its class definition. These reference labels are the prediction target; the work did not newly measure transport through human barrier cells.
Eleven baseline classifiers were compared with stratified tenfold cross-validation. Logistic Regression had accuracy of 0.881 and F1-score of 0.925, while Random Forest had accuracy of 0.877 and F1-score of 0.924. Random Forest’s positive-class recall was 0.978, compared with 0.962 for Logistic Regression. These close aggregate results led to further comparisons of the two model families.
Improving One Class Came With a Different Error Balance
The resampling tables report a separate single-run evaluation containing 587 compounds: 448 positive and 139 negative reference labels. Without resampling, Random Forest correctly classified 443 positives and 87 negatives, with five false negatives and 52 false positives. Its accuracy was 0.903 and its receiver operating characteristic area under the curve, or ROC AUC, was 0.807.
With synthetic minority oversampling, known as SMOTE, the same table reports 442 true positives and 90 true negatives. Accuracy increased slightly to 0.906 and ROC AUC to 0.817, while recall decreased from 0.989 to 0.987. The method generated additional minority-class examples within the training data; it did not add newly measured compounds to the test set.
The approach labeled undersampling shifted the balance further. Correct negative classifications increased to 97, and false positives fell to 42. However, false negatives increased to 20, and positive-class recall fell to 0.955. ROC AUC rose to 0.827 while accuracy fell to 0.894. These outcomes show that the preferred model depends on the cost assigned to different screening errors.
Logistic Regression was more sensitive to the same interventions. Its SMOTE ROC AUC rose from 0.764 to 0.791, but recall fell from 0.938 to 0.913. The study’s resampling comparisons therefore provide a trade-off analysis rather than a uniform improvement across every performance measure. The single-run table values also remain distinct from the cross-validation averages.
Descriptor Associations Do Not Establish Universal Permeability Rules
Random Forest feature analysis ranked the NHOHCount descriptor, representing NH/OH groups, and NOCount, representing nitrogen and oxygen atoms, among the most influential variables. Molecular size and several fingerprint features also contributed. The authors examined how reference permeability labels and prediction errors varied across these groups.
Compounds with zero or one NH/OH group had a labeled permeability rate above 80%, while those with four or more were below 20%. Reported classification accuracy fell from 94.0% for compounds with no such groups to 67.9% for those with three, then recovered in the higher-count group. This pattern identifies an error-prone region of the analyzed chemical dataset. It does not by itself establish three groups as a universal mechanistic boundary.
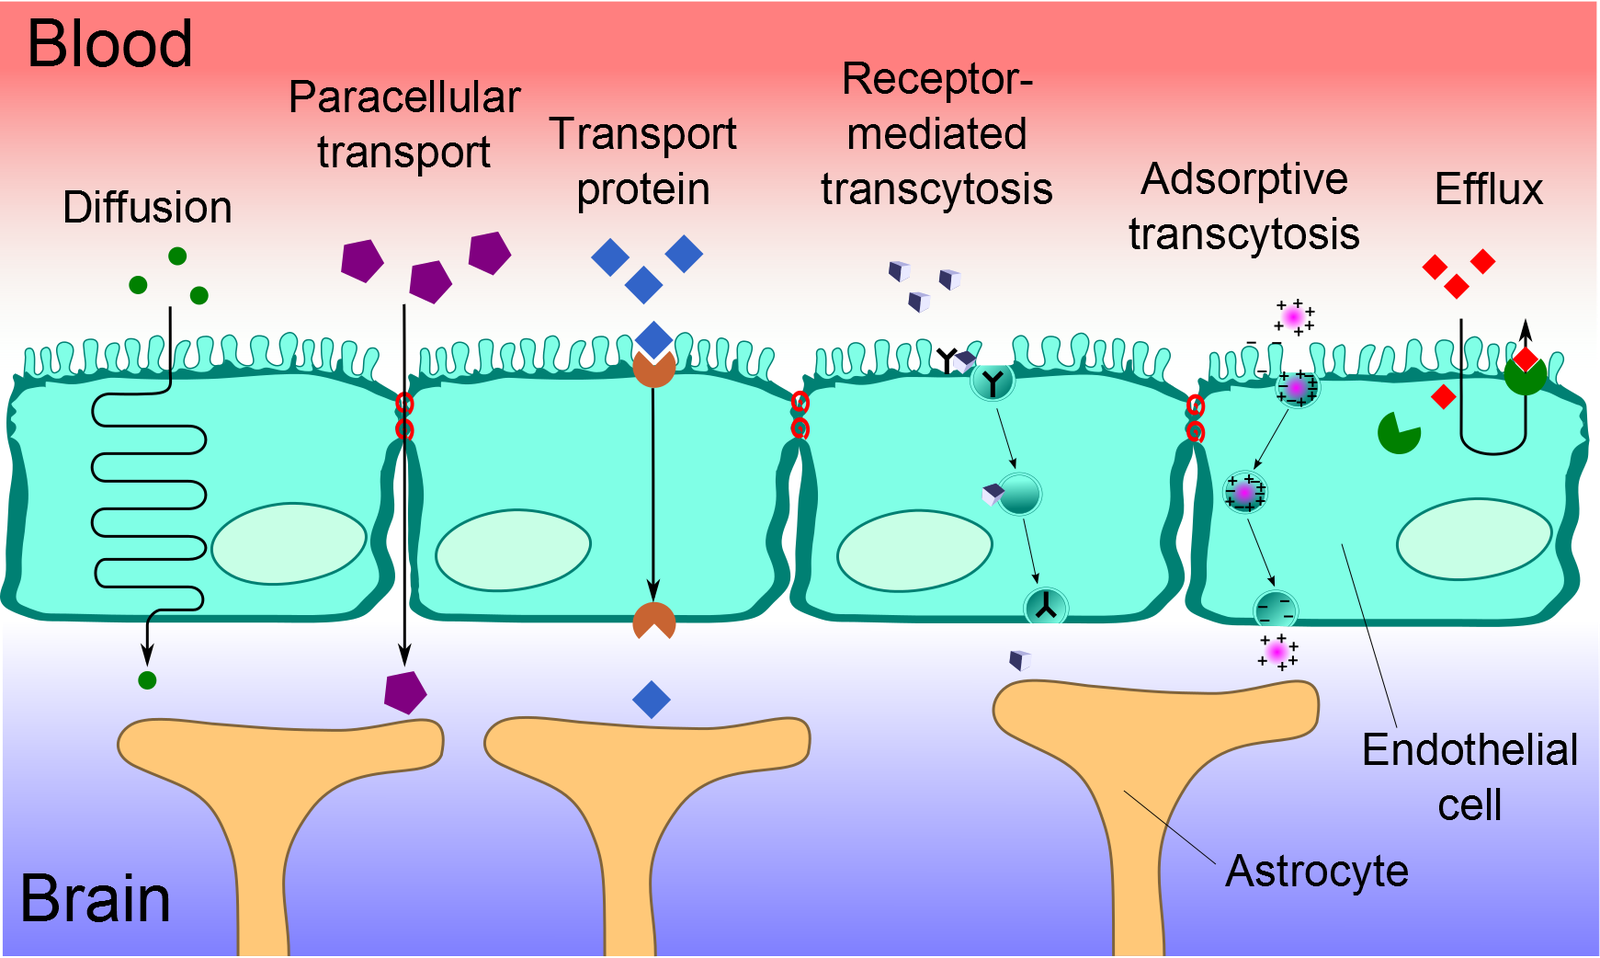
The analysis emphasizes descriptors associated with passive diffusion. It does not explicitly model P-glycoprotein or BCRP transport, multiple ionization states or a pH-dependent permeability process. Molecular feature importance also describes how this classifier used correlated inputs, with interpretation bounded by the represented compounds and labels.
The authors identify external scaffold-based testing and newly synthesized compounds as future validation steps. Their internal comparisons cannot establish reliability for an unfamiliar chemical series. For drug discovery, the reported value lies in comparing classification errors and locating uncertain descriptor regions alongside established barrier assays, while preserving the distinction between reference-label prediction and direct biological validation.